CNS is a thriving school that has enjoyed excellent outcomes once again in 2025. We continue to celebrate superb outcomes and individual performances amongst students sitting their GCSEs, BTECs and A levels. These results are always secured through the combined hard work and commitment of students, parents and carers and the entire staff body at our school.
Below appears the statutory data that all schools must share with families, followed by a more comprehensive summary of outcomes.

KS4 performance data summary 2025
(all school data remains provisional until early 2026)
| Attainment 8 | 50 | |
| % of all grades that were 9-7 | 28 | |
| % of all grades that were 9-4 | 80 | |
| % Standard Pass English and Maths (Grades 9-4) | 77 | |
| % Strong Pass English and Maths (Grades 9-5) | 60 | |
| Ebacc | ||
| % of pupils entered | 13 | |
| % of pupils achieved | 12 | |
| Destinations | ||
| % of pupils staying in education or employment with training | TBC | |
Click here for school performance data provided by the Department for Education (this will be updated to reflect this year’s national results in November 2025)
KS5 performance data summary 2025
(all school data remains provisional until early 2026)
| % A*- A | 27 |
| % A*- B | 56 |
| % A*- C | 80 |
| % A*- E | 99 |
| Average grade | B- |
| Student retention (% of students completing their study programme) | 97% |
| Student destinations (% of students who continue in education or training or who move into employment) | TBC |
Click here for school performance data 16-18 provided by the Department for Education (this will be updated to reflect this year’s national results in November 2025).
Please see below for more detailed results over time.


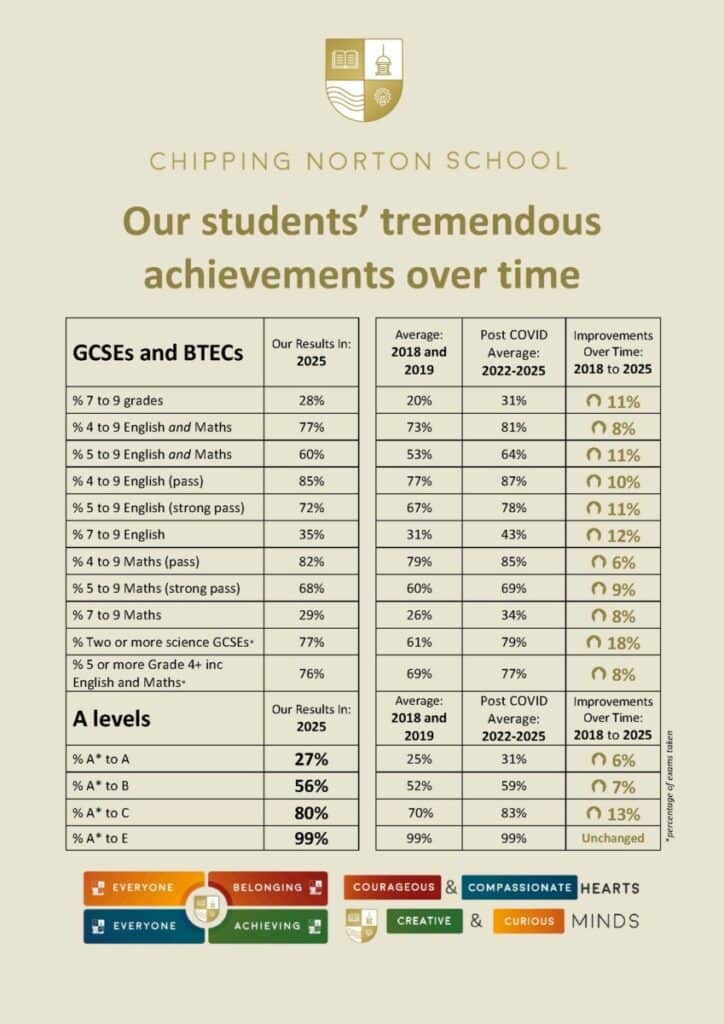
GCSE, BTEC and A level detailed summary: 2019 to 2023
A-level Results
| A levels | Our Results In: 2025 | Average: 2018 and 2019 | Post COVID Average: 2022-2025 | Improvements Over Time: 2018 to 2025 |
|---|---|---|---|---|
| % A* to A | 27% | 25% | 31% | 6% |
| % A* to B | 56% | 52% | 59% | 7% |
| % A* to C | 80% | 70% | 83% | 13% |
| % A* to E | 99% | 99% | 99% | Unchanged |
*Students did not sit any examinations in the United Kingdom in 2020 and 2021. Results were based on centre and teacher assessed grades and appear here for illustrative purposes only.
**Grading standards returned to 2019 levels in 2023 across England, making 2023 and 2019 outcomes comparable.
| GCSEs and BTECs | Our Results In: 2025 | Average: 2018 and 2019 | Post COVID Average: 2022-2025 | Improvements Over Time: 2018 to 2025 |
|---|---|---|---|---|
| % 7 to 9 grades | 28% | 20% | 31% | 11% |
| % 4 to 9 English and Maths | 77% | 73% | 81% | 8% |
| % 5 to 9 English and Maths | 60% | 53% | 64% | 11% |
| % 4 to 9 English (pass) | 85% | 77% | 87% | 10% |
| % 5 to 9 English (strong pass) | 72% | 67% | 78% | 11% |
| % 7 to 9 English | 35% | 31% | 43% | 12% |
| % 4 to 9 Maths (pass) | 82% | 79% | 85% | 6% |
| % 5 to 9 Maths (strong pass) | 68% | 60% | 69% | 9% |
| % 7 to 9 Maths | 29% | 26% | 34% | 8% |
| % Two or more science GCSEs* | 77% | 61% | 79% | 18% |
| % 5 or more Grade 4+ inc English and Maths* | 76% | 69% | 77% | 8% |